Annex B to The Decreasing-Term Anachronism (MWP-2026-03). Stochastic-rates calibration, methodology journey, and pre-simulation diagnostics.
Purpose of this annex. The parent paper uses a deterministic 4.0% mortgage interest rate in its base case. Interest rates are not, in practice, deterministic. This annex documents the calibration of the stochastic-rates framework run as a 50,000-path overlay (Annex A), to test the directional robustness of the HARM A, HARM B and SCR_mort numbers under rate paths consistent with what the Eurosystem and Irish mortgage data permit.
Executive summary
We calibrate four lenses on Irish mortgage-rate uncertainty. None alone is sufficient; together they bracket the directional risk in a way that is defensible given the limited Eurosystem rate-cycle history available.
| Lens | Role | Key parameter(s) |
|---|---|---|
| Primary — block bootstrap of the Irish mortgage rate | Headline (Irish translation; no parametric assumption) | Stationary bootstrap, block = 24 months on monthly differences of CBI/ECB MIR (n = 278 source diffs). |
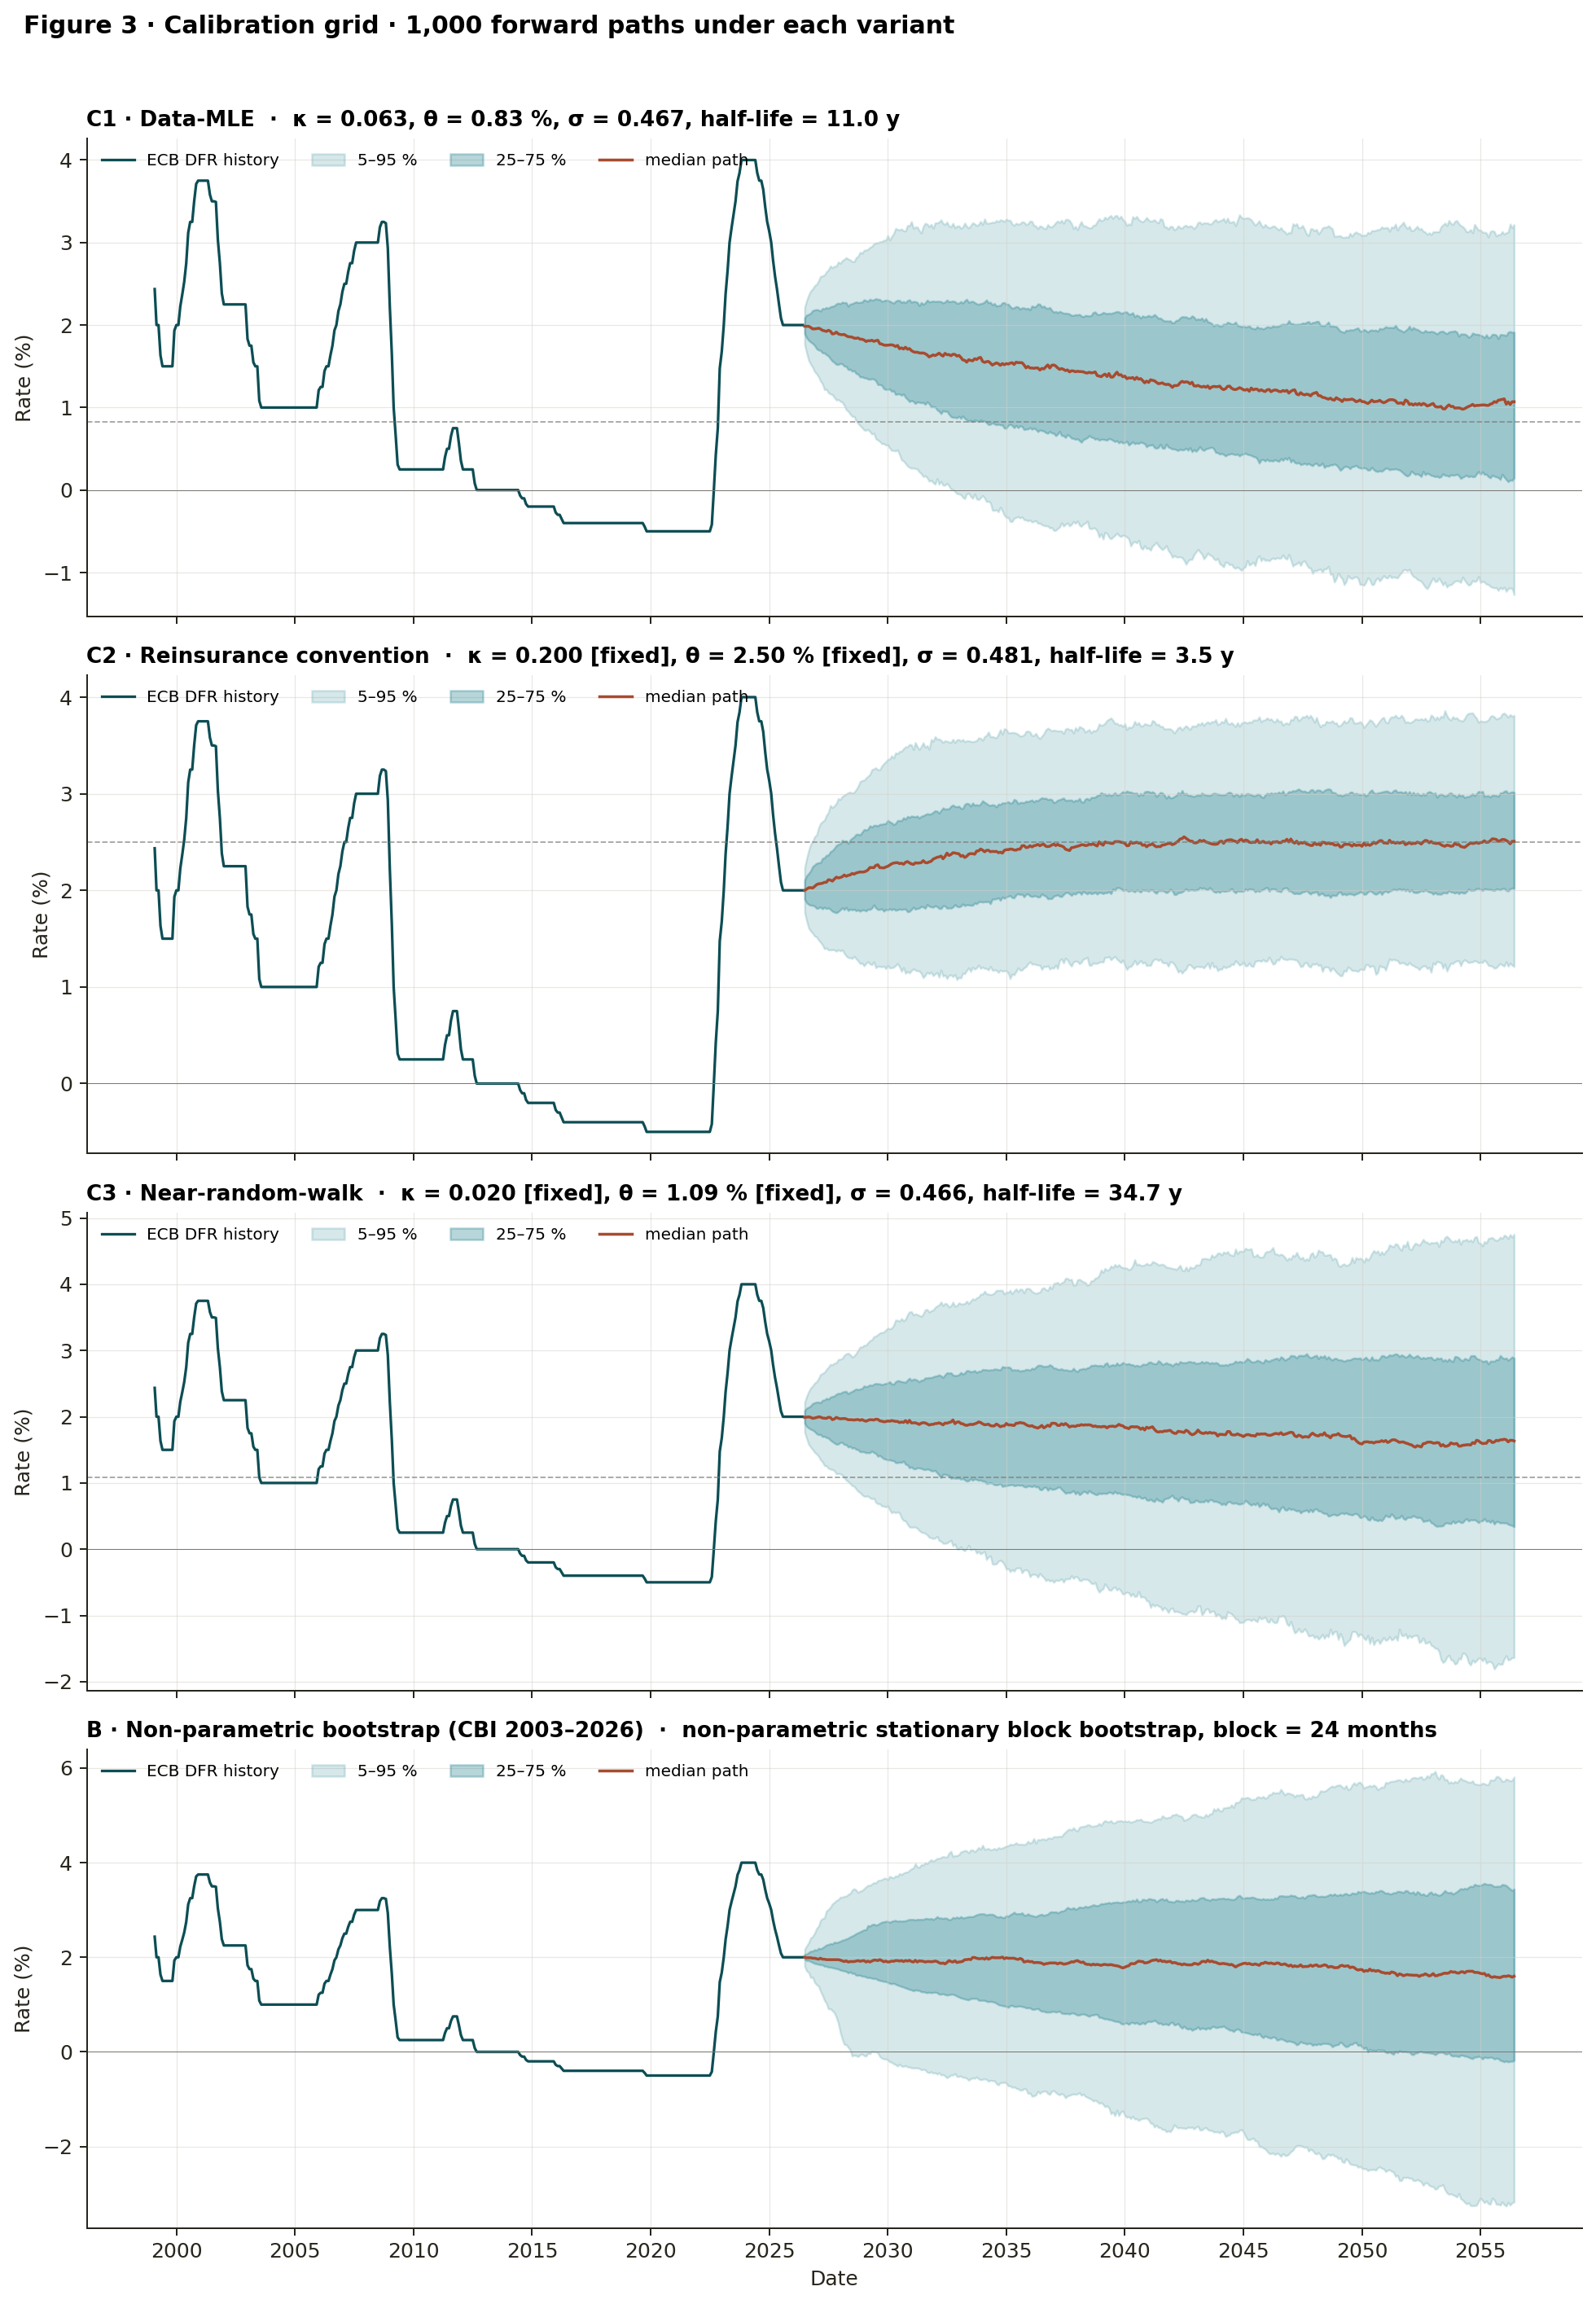
| Vasicek C1 · data-MLE | Parametric ECB-driver sensitivity (what the data alone identifies) | κ = 0.063 (±0.063), θ = 0.83%, σ = 0.467 |
| Vasicek C2 · reinsurance convention | Industry-standard mean-reversion parameters | κ = 0.20 [fixed], θ = 2.50% [fixed], σ = 0.481 |
| Vasicek C3 · near-random-walk | Conservative-persistence end of the sensitivity range | κ = 0.02 [fixed], θ = 1.09% [fixed at data mean], σ = 0.466 |
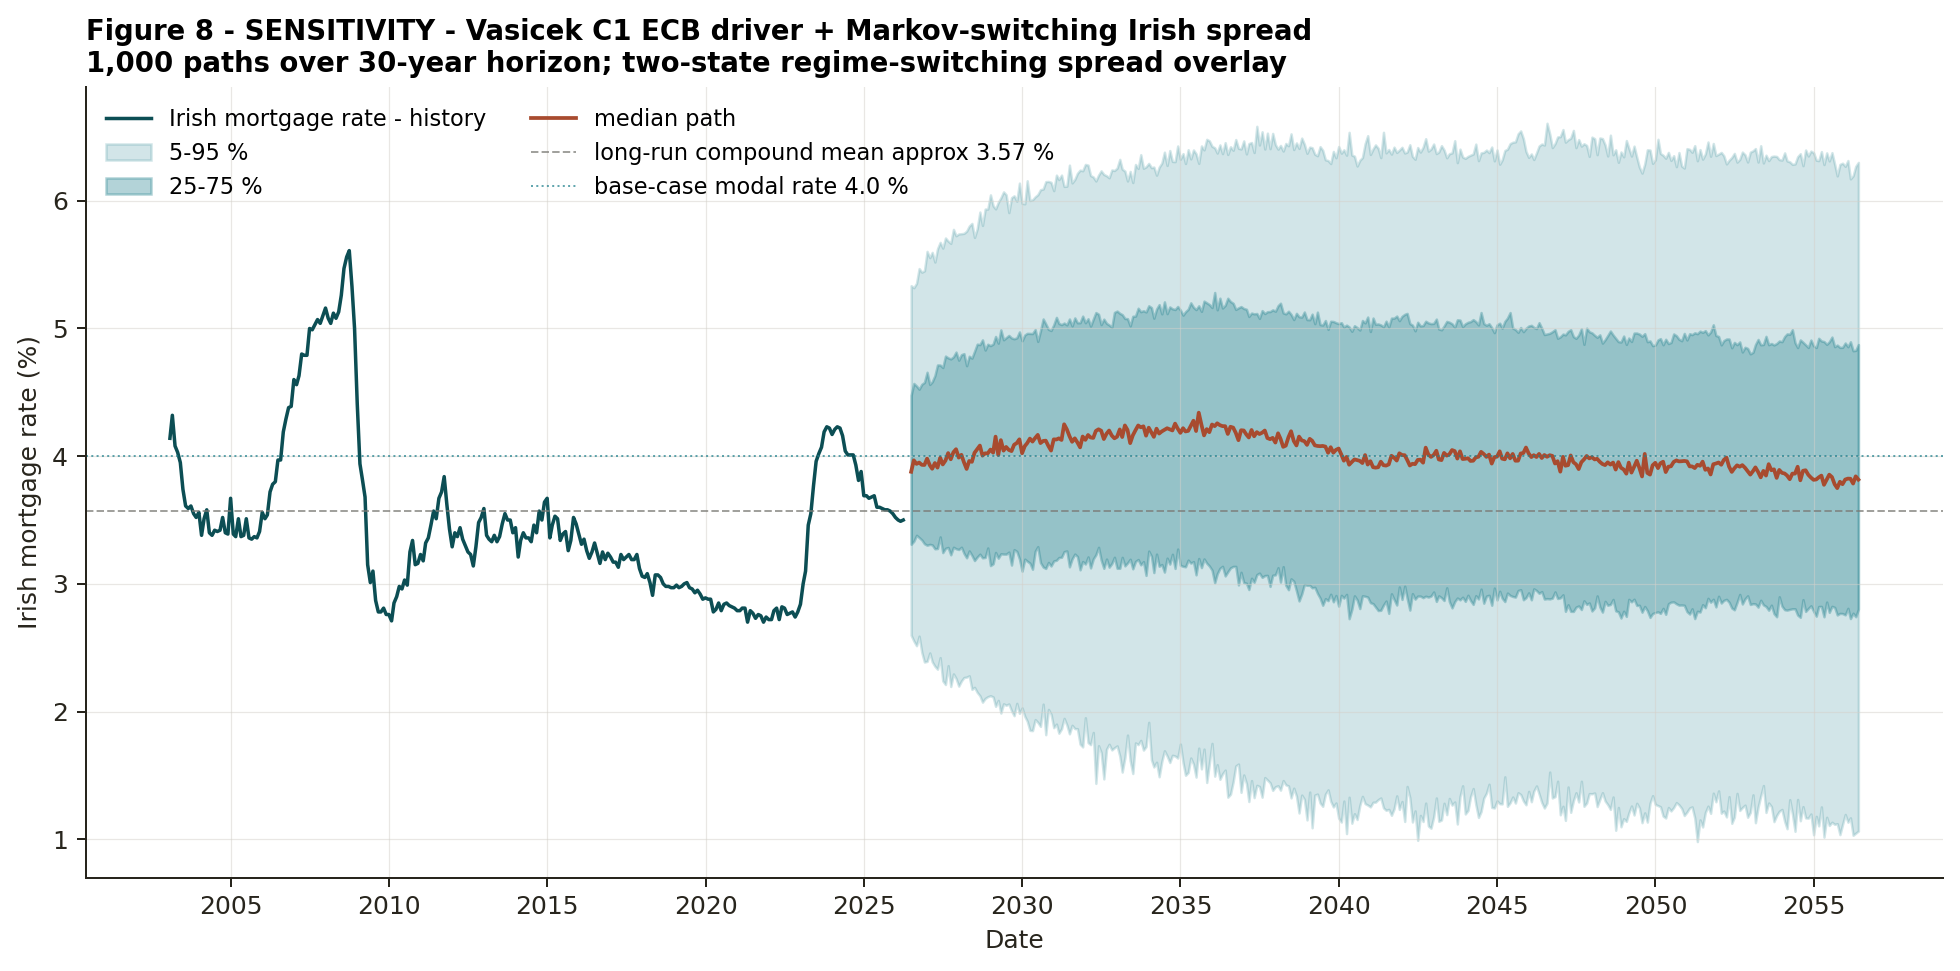
| Markov-switching spread (2-state) | Sensitivity overlay on Vasicek C1 | State 0 μ = 1.92 pp, State 1 μ = 3.38 pp; P[0,0] = 0.991, P[1,1] = 0.993. |
An AR(1) Irish-spread model was attempted as a simpler alternative. We report its calibration and diagnostic failure (§5) as the methodology journey: the Ljung-Box test rejects white-noise residuals decisively, and the persistence parameter sits within two standard errors of a unit root. This is the basis for moving the headline lens to a non-parametric bootstrap on the Irish rate directly.
1. Data sources and calibration windows
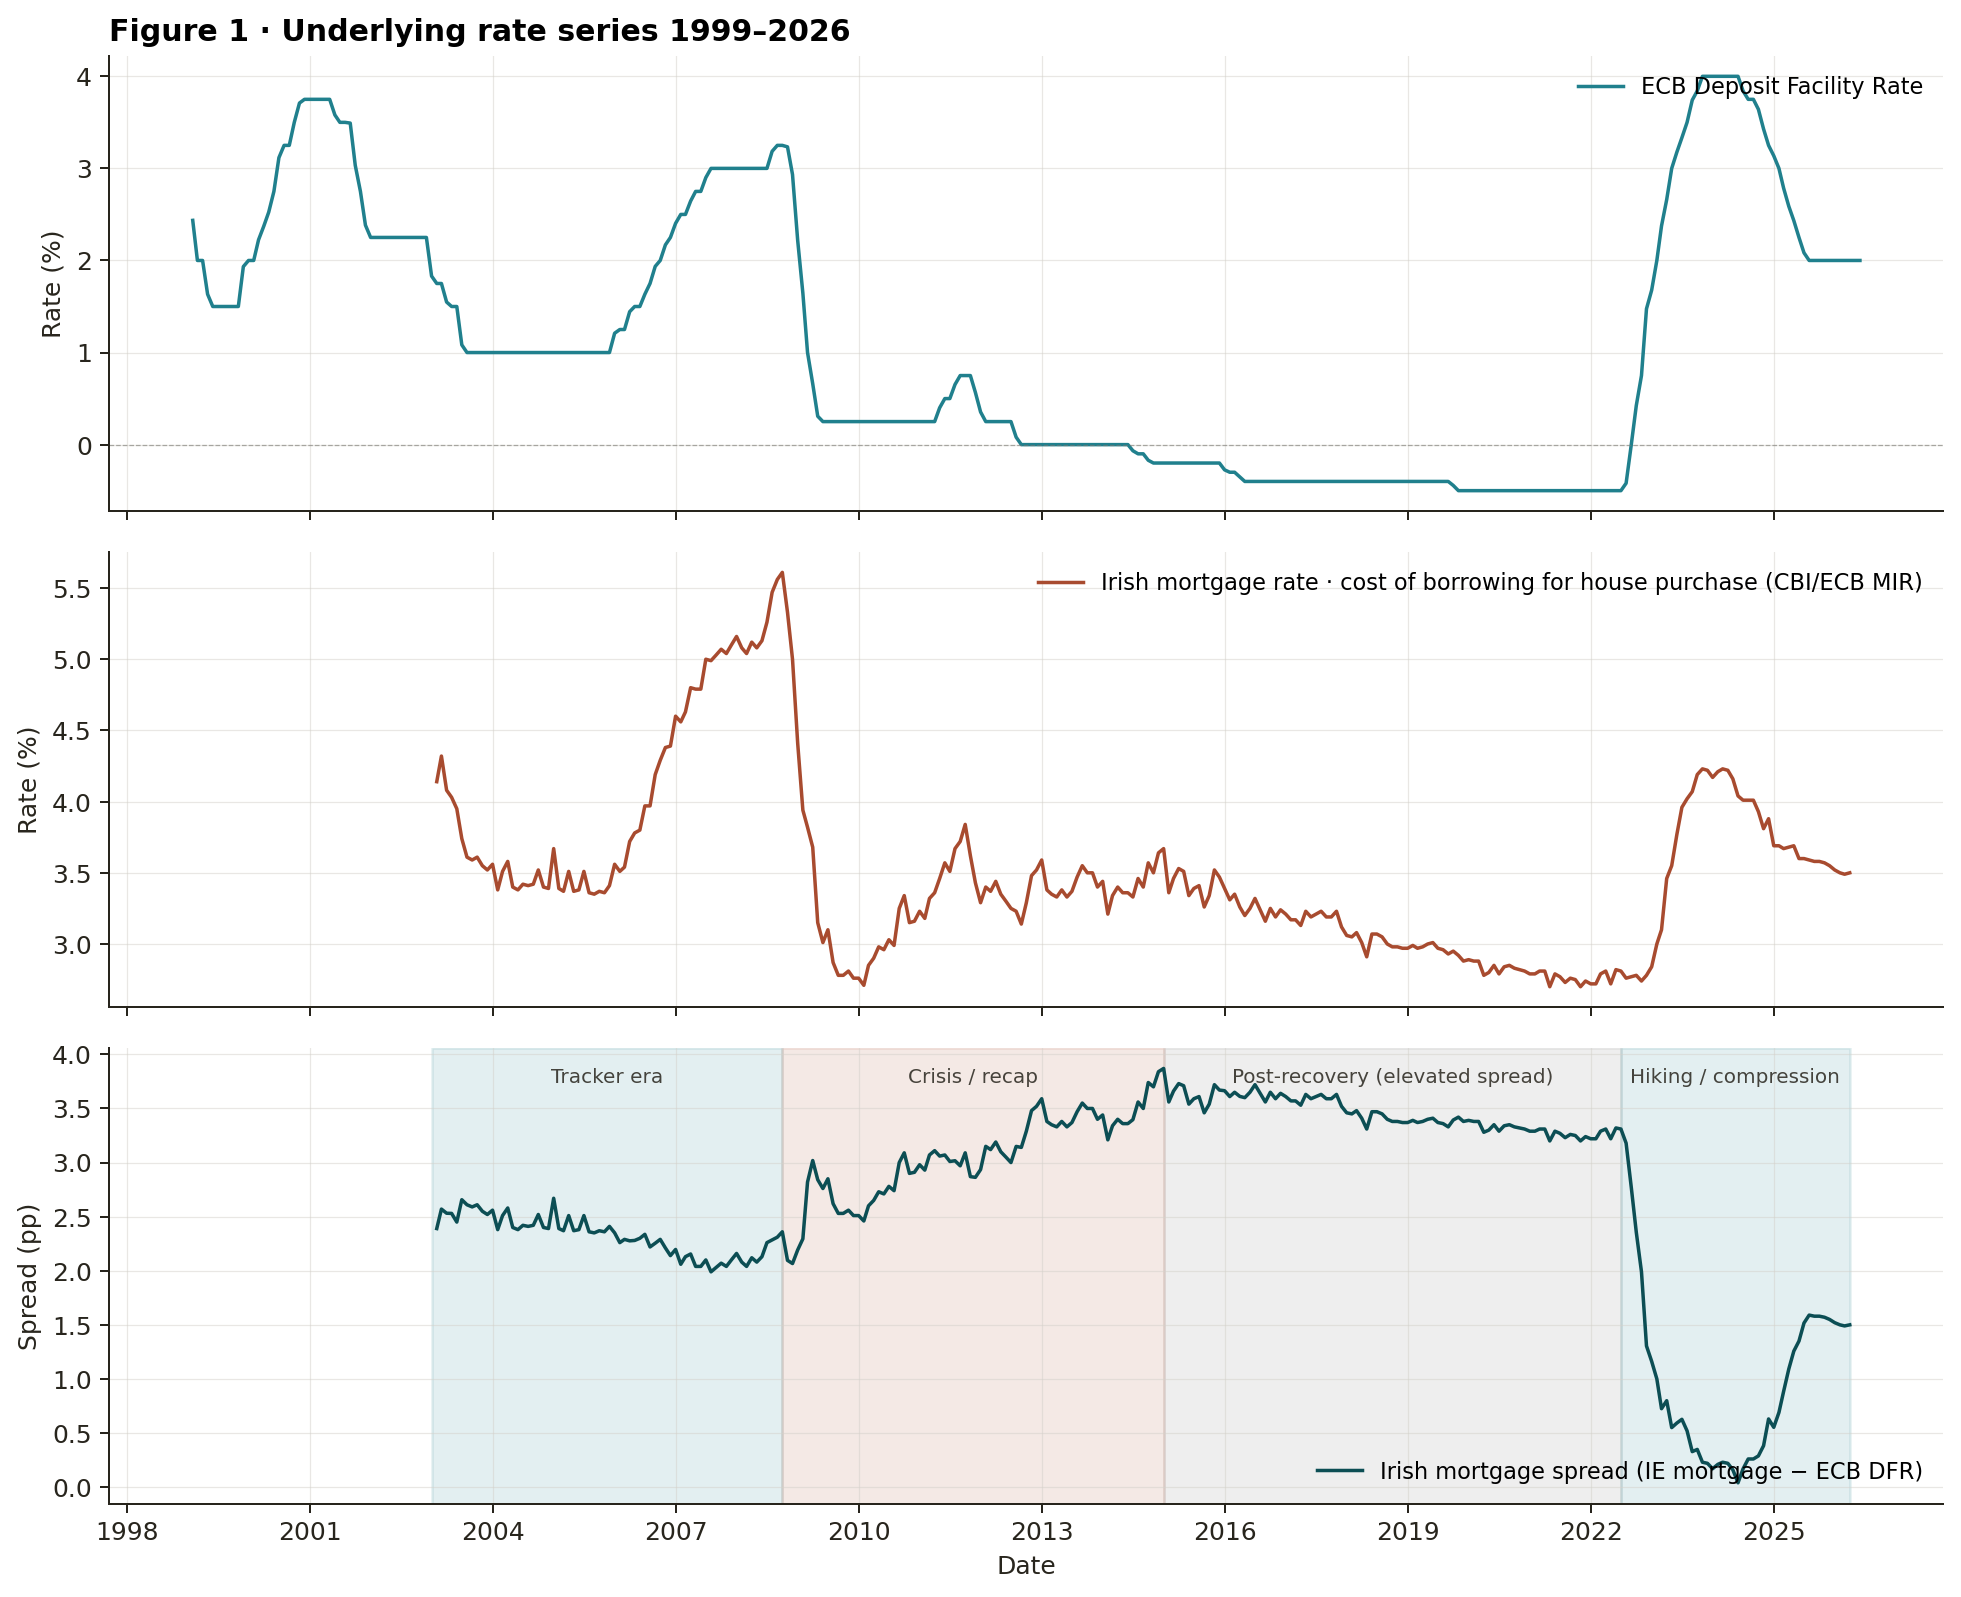
Two authoritative series underpin the pack, both obtained from the ECB Statistical Data Warehouse; the Irish mortgage-rate series is the same MIR statistic the Central Bank of Ireland publishes monthly.
| Series | Identifier | Window | n |
|---|---|---|---|
| ECB Deposit Facility Rate | FM.D.U2.EUR.4F.KR.DFR.LEV | 1999-01 to 2026-05 | 329 |
| Irish mortgage interest rate | MIR.M.IE.B.A2C.AM.R.A.2250.EUR.N | 2003-01 to 2026-03 | 279 |
| Irish mortgage spread | Irish mortgage rate − ECB DFR | 2003-01-31 to 2026-03-31 | 279 |
The ECB DFR is the policy-rate driver because the Irish mortgage market is dominated by variable-rate, tracker and short-fix products; pillar Irish lenders price their funding off Eurosystem facilities, not against long-dated Bund yields. A backward-extended Bundesbank Pfandbrief or hypotheken-rate series would import a different monetary regime and is rejected as inappropriate for Irish mortgage projection.
2. Block bootstrap of the Irish rate
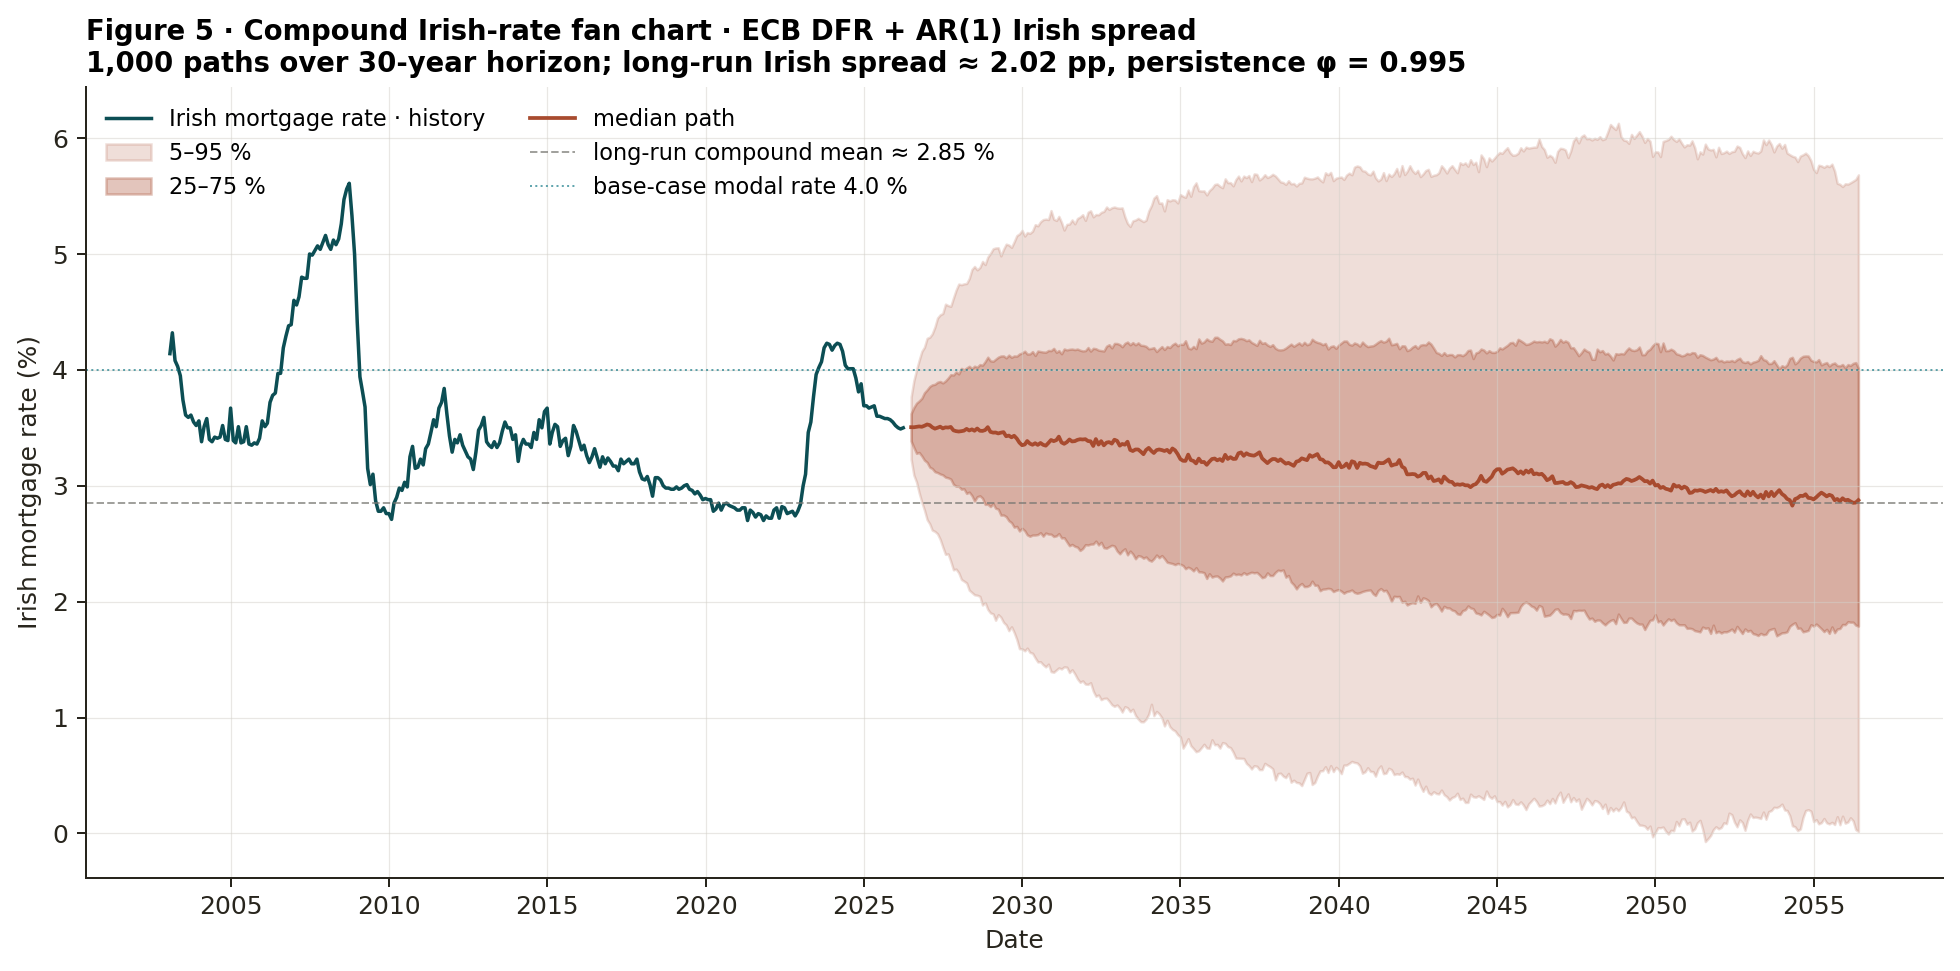
The headline Irish translation is a stationary block bootstrap of the Irish mortgage-rate monthly differences. Each simulated path is built by drawing geometrically-distributed blocks of historical first differences (mean block length 24 months) and accumulating them from the spot rate (3.49% modal at March 2026; 3.50% at the last observation).
Three reasons the bootstrap is the headline: it makes no parametric distributional assumption and therefore inherits the regime mix observed in 2003–2026 rather than asserting it; it is robust to the diagnostic failure of the AR(1) spread model (§5); and block bootstrapping preserves the within-block autocorrelation of the differences without requiring a functional form for that persistence. The trade-off is honest: the bootstrap cannot extrapolate beyond the regime mix it has seen. The parametric variants in §3 address this by permitting the long-run mean to differ from the historical mean by construction.
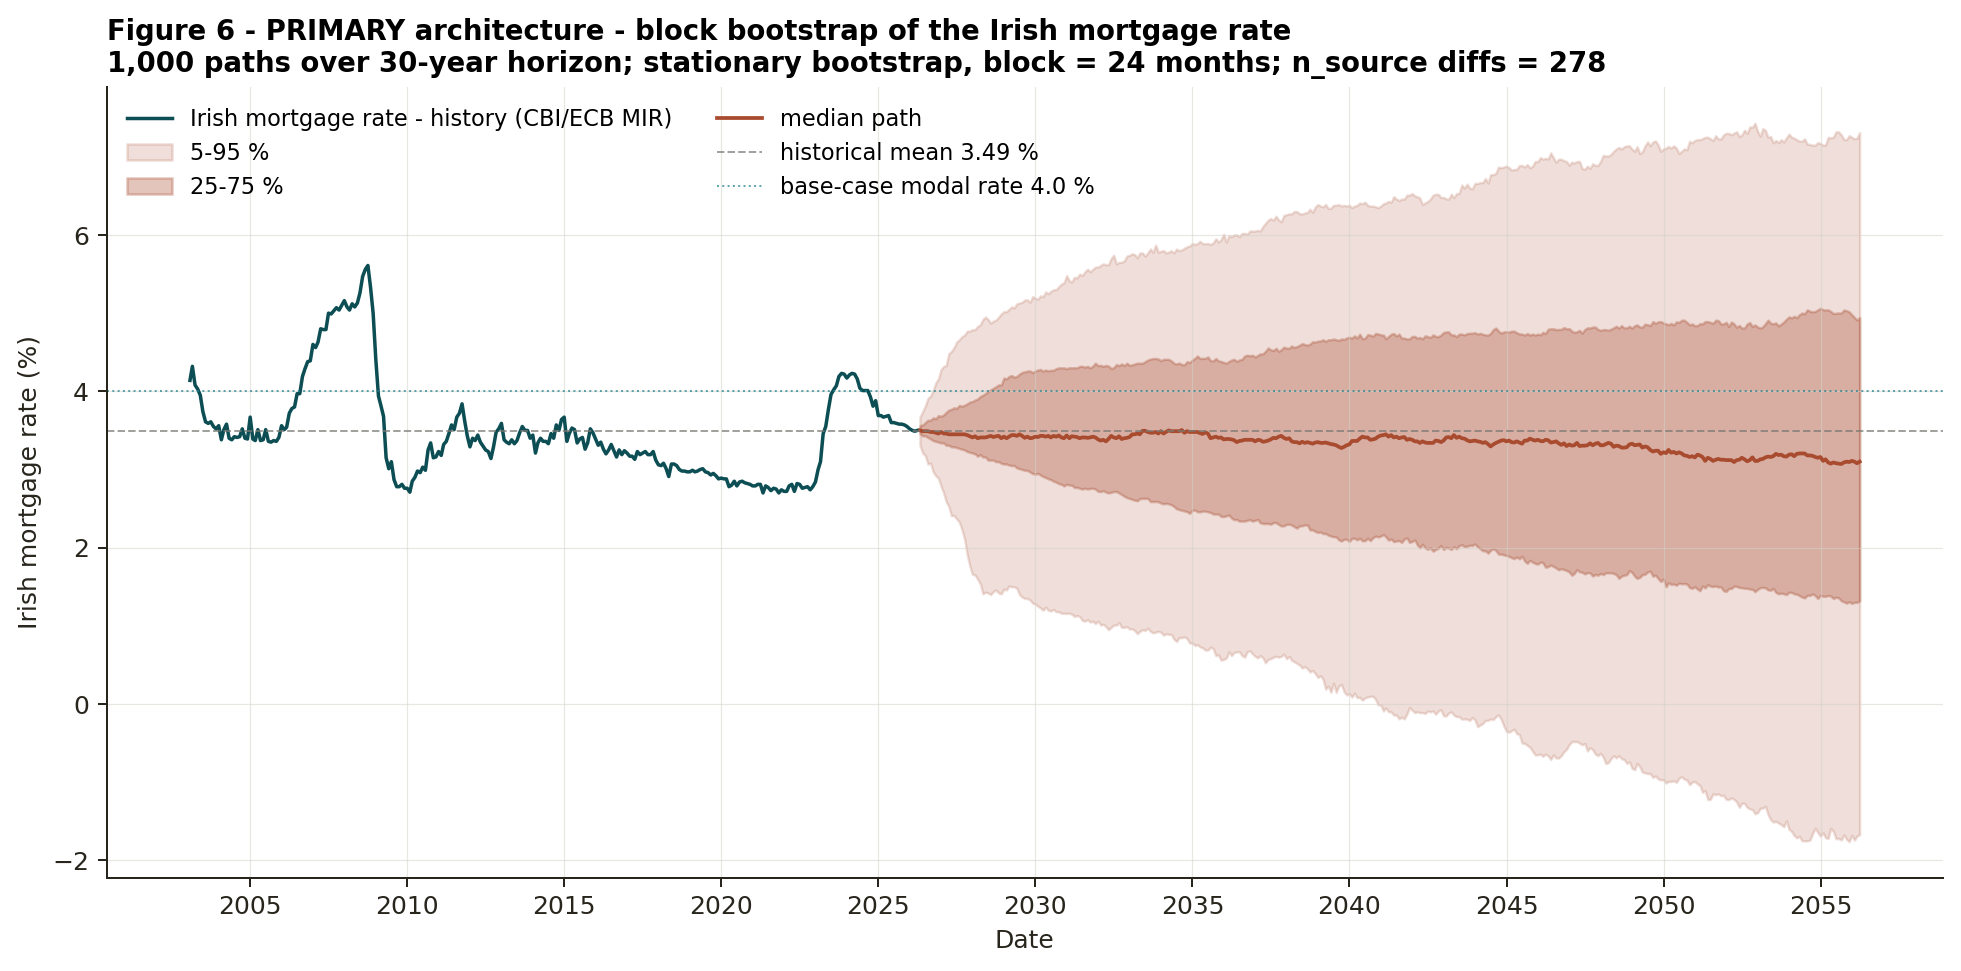
Under the bootstrap, the median path drifts gently toward the historical mean, reflecting the symmetric mix of easing and tightening episodes in the source window. The 25–75% cone holds the mortgage rate broadly between 2% and 5% over the horizon; the 5–95% cone reaches negative territory at the lower edge by the end of the horizon, a consequence of the source window including the 2014–2022 ZIRP/NIRP regime. The realised Irish mortgage rate did not become negative; the ECB policy rate did. The harm-metric overlay truncates to a 0% floor accordingly.
3. Three Vasicek variants
The Vasicek short-rate model dr = κ(θ − r) dt + σ dW is the canonical Gaussian Ornstein-Uhlenbeck process used in life and general-insurance ALM. The 27-year EUR sample contains approximately one and a half ECB policy-rate cycles, so maximum-likelihood identification of κ is intrinsically weak; the data informs σ well, but cannot tell us whether the process is highly mean-reverting around a low long-run mean (C1), modestly mean-reverting around a moderate mean (C2), or a near-random-walk (C3). The honest response is to present all three.
| Variant | κ | θ (%) | σ | Half-life | Log-lik |
|---|---|---|---|---|---|
| C1 · Data-MLE (free κ, θ, σ) | 0.063 (SE 0.063) | 0.83 (SE 1.44 pp) | 0.467 (SE 0.018) | 11.0 y | 192.9 |
| C2 · Reinsurance convention (κ, θ fixed; σ free) | 0.200 [fixed] | 2.50 [fixed] | 0.481 | 3.5 y | 185.1 |
| C3 · Near-random-walk (κ, θ fixed; σ free) | 0.020 [fixed] | 1.09 [fixed] | 0.466 | 34.7 y | 192.6 |
Note the standard error on κ in C1: SE = 0.063 against an estimate of 0.063. The data is unable to distinguish C1's κ from zero at conventional levels — not a model failure, but the data telling us that 27 years is too short to identify mean reversion precisely. Presenting C1 alone would imply false precision; C2 and C3 bracket the range, and we make no claim that any one is the "right" calibration.
4. Regime-switching spread
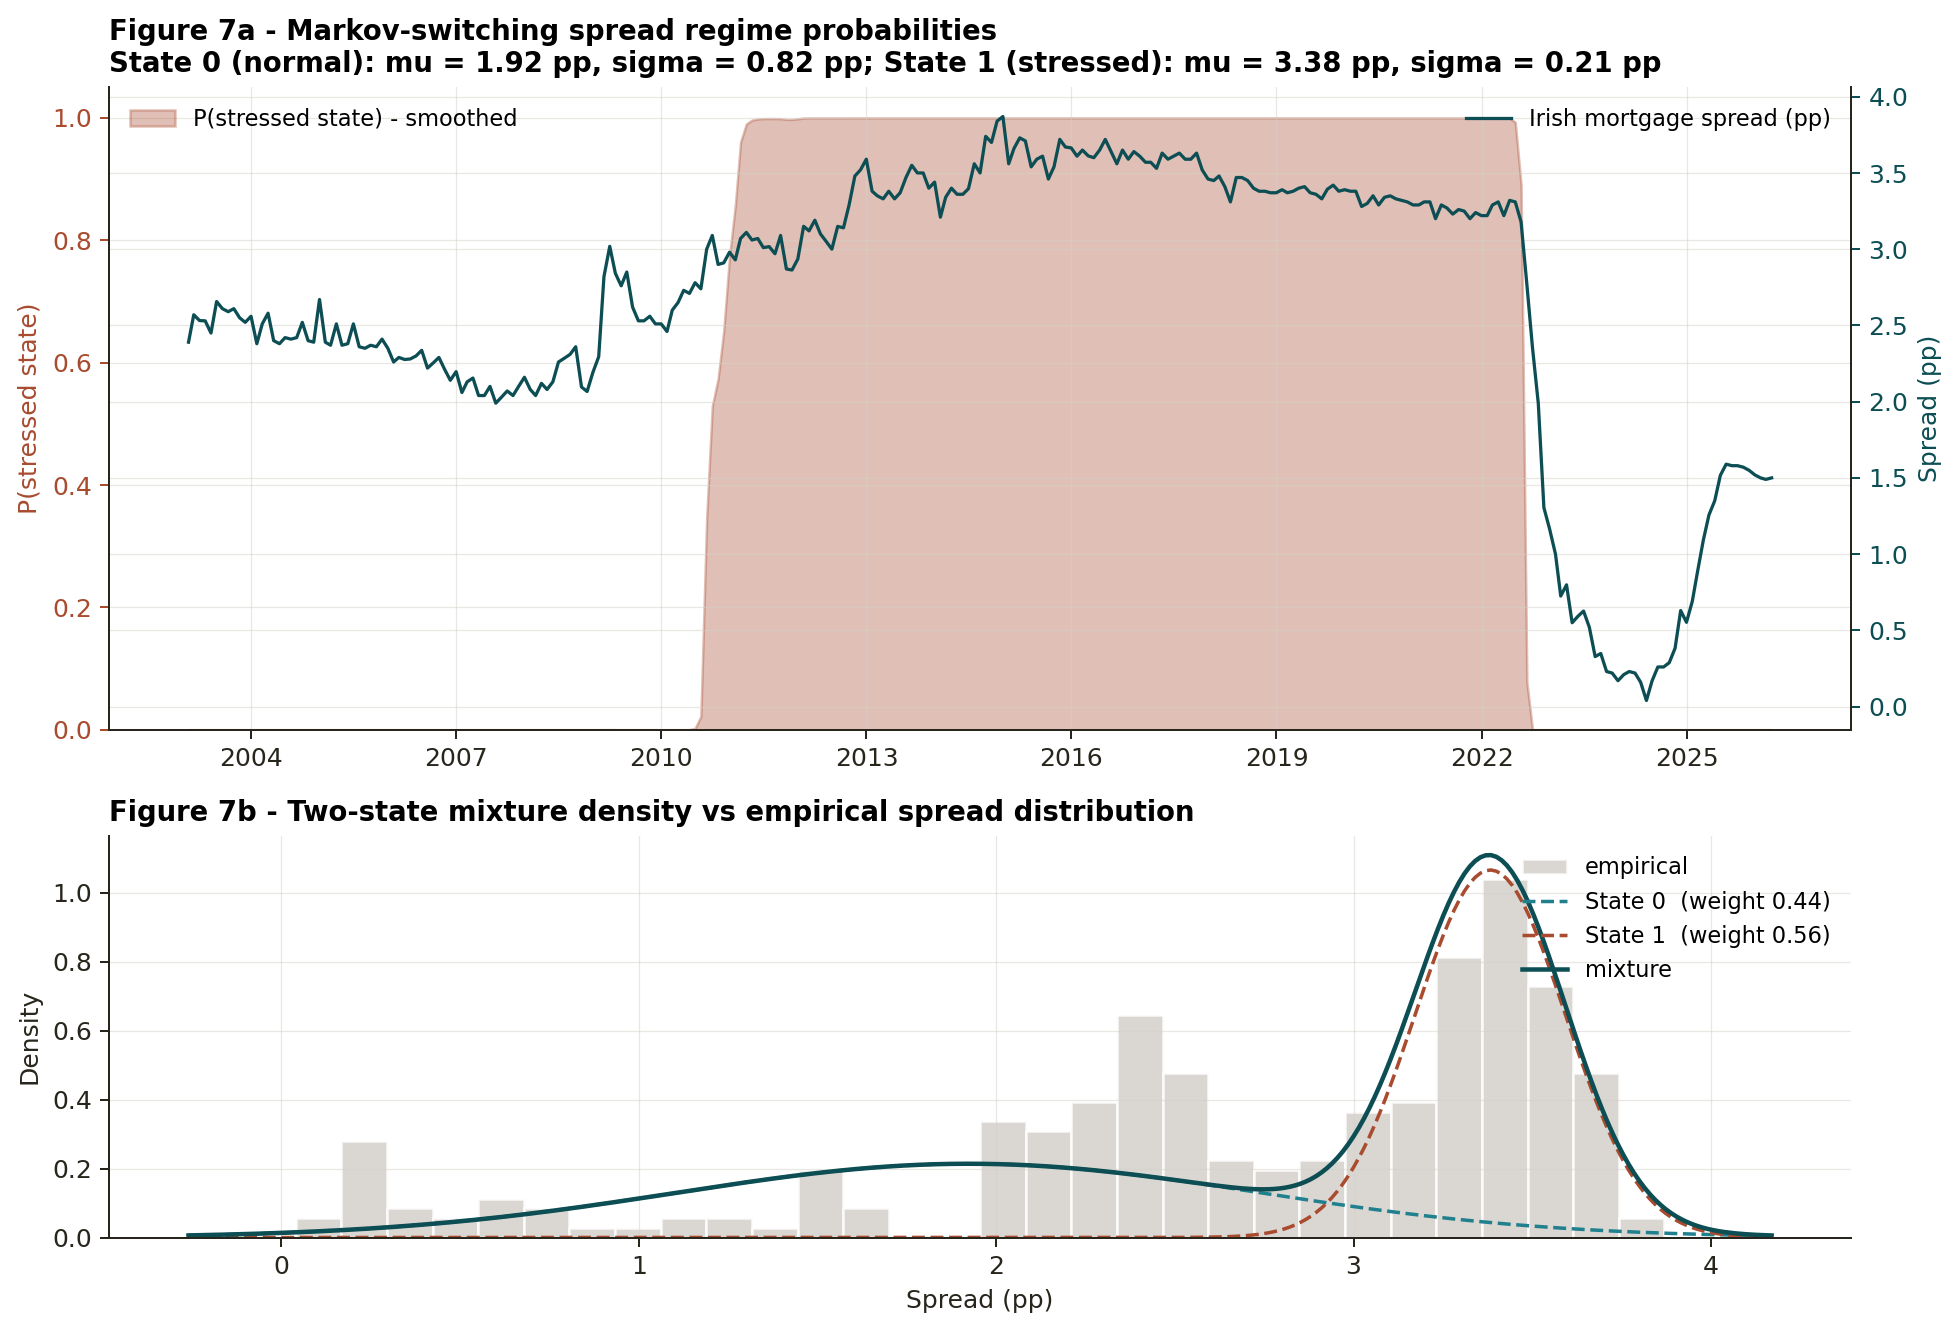
To represent the documented structural break in the Irish mortgage spread, we fit a two-state Markov-switching model on the monthly spread series. The Hamilton filter with Kim's smoother is used for the E-step; EM converges in 14 iterations to a log-likelihood of −157.2.
| Parameter | State 0 · normal | State 1 · stressed |
|---|---|---|
| Mean spread μ (pp) | 1.923 | 3.383 |
| Volatility σ (pp) | 0.817 | 0.210 |
| Self-transition probability Pkk | 0.9912 | 0.9931 |
| Stationary weight | 0.438 | 0.562 |
| Expected duration (months) | 114 | 146 |
The smoothed state probability places 2003–Sep 2010 in the normal state, Oct 2010–Aug 2022 in the stressed state, and Sep 2022 onwards back in the normal state — matching the historical narrative of the tracker era, the post-crisis SVR elevation, and the recent ECB hiking cycle compressing the spread. The empirical histogram is visibly bimodal, a feature no stationary AR model can represent. The pack treats the regime-switching model as a sensitivity overlay rather than the headline because the 23-year window contains only one full regime transition and one partial reversal; the transition-probability estimates are weakly identified.
5. Why AR(1) was insufficient
Before reaching the bootstrap-primary architecture, we calibrated a simpler AR(1) model on the spread. We report that work and its diagnostic failure in full, because the failure is the evidence that motivated the re-architecture.
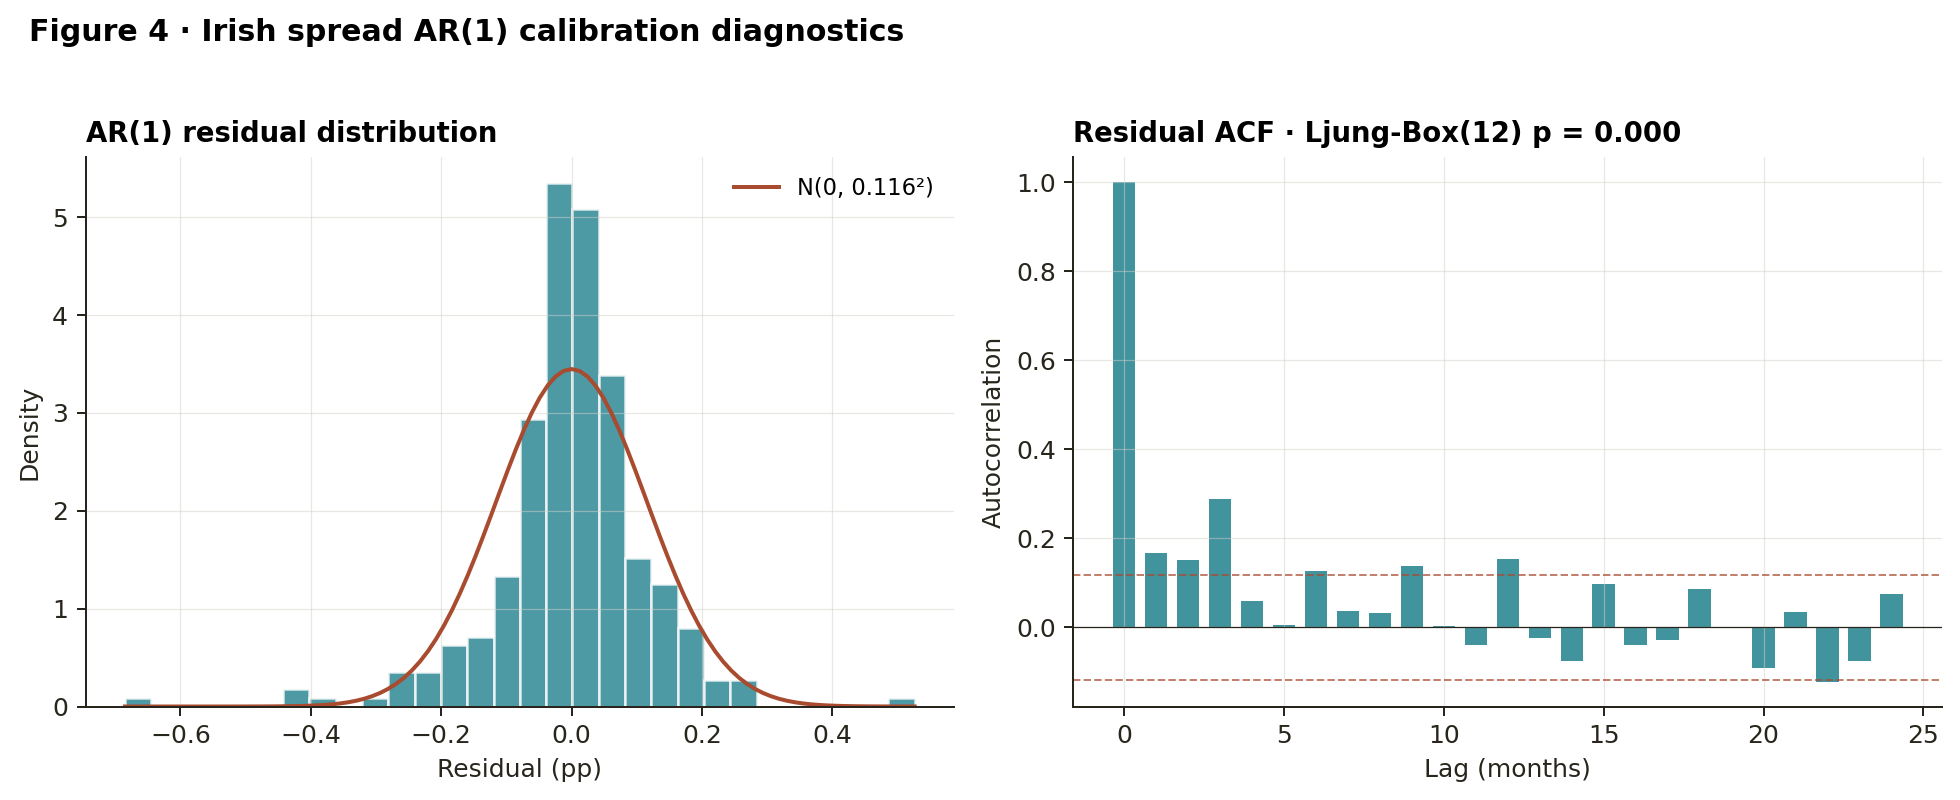
| Parameter | Estimate | Standard error |
|---|---|---|
| c (intercept, pp) | 0.0100 | 0.0209 |
| φ (persistence) | 0.9951 | 0.0074 |
| σe (residual std, pp) | 0.1158 | — |
| Implied long-run mean (pp) | 2.0205 | — |
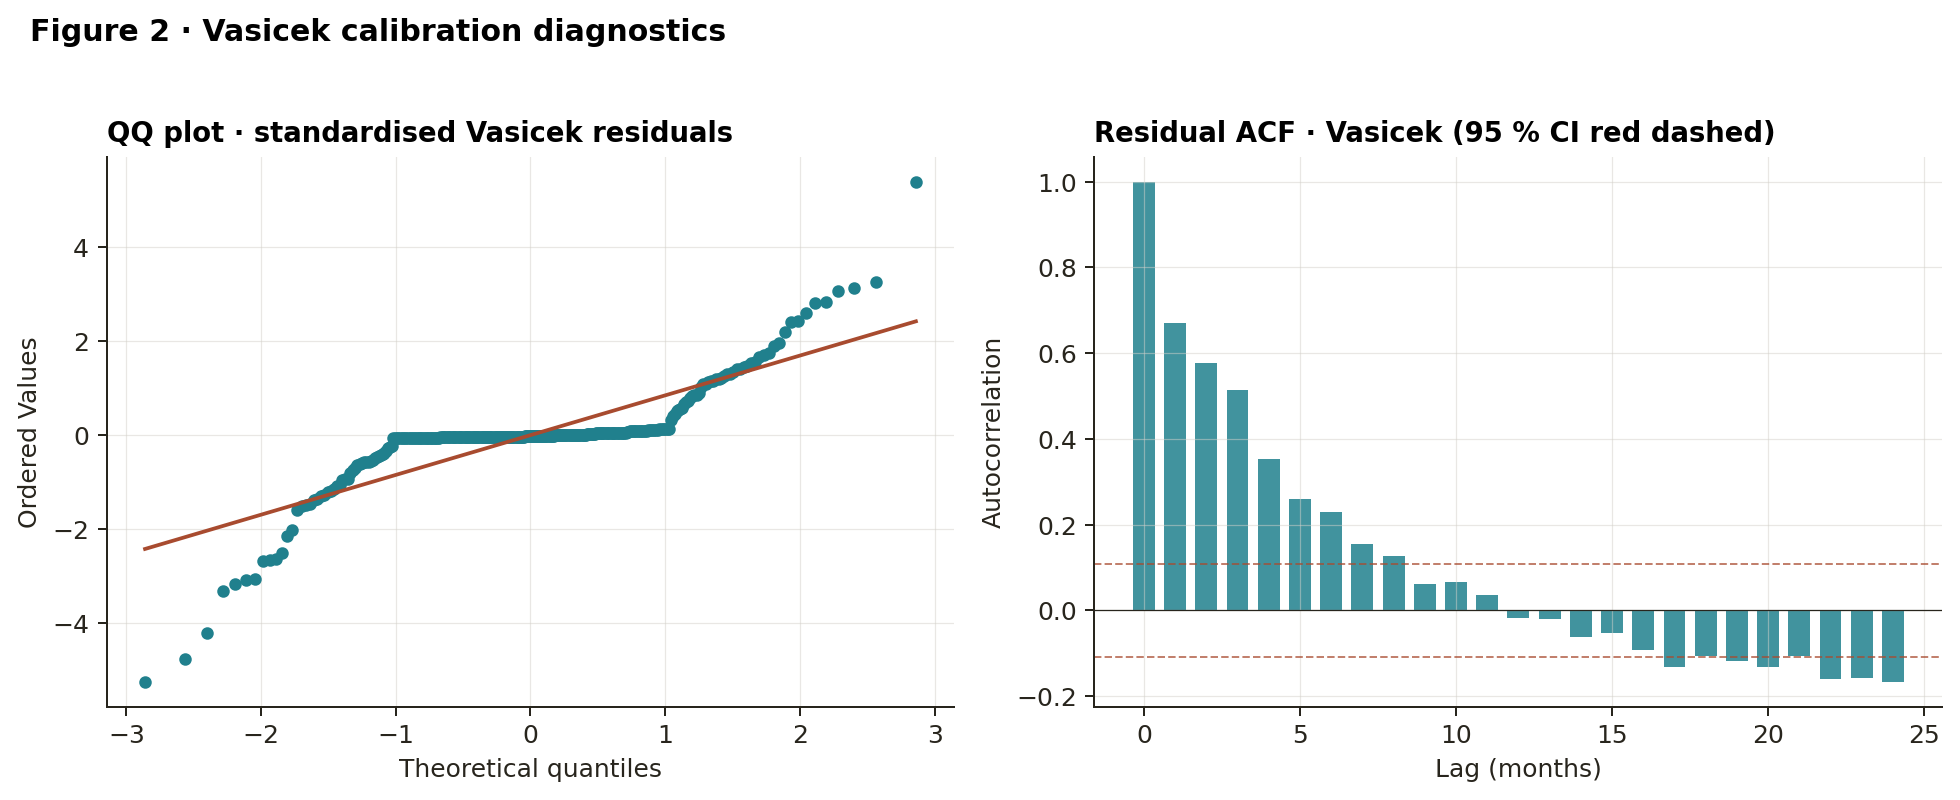
| Ljung-Box(12) statistic | 56.84 | p = 8.46e-08 |
Two diagnostic flags. Near-unit-root persistence: φ = 0.9951 with SE 0.0074; the 95% confidence interval includes values arbitrarily close to one, indicating the AR(1) is absorbing structural level shifts as "very slow mean reversion" rather than modelling them. Ljung-Box(12) p = 8.46e-08: the residuals retain significant autocorrelation through lag 12; the white-noise null is rejected decisively. Inspection identifies the cause: two structurally distinct regimes (tracker / recent-hiking vs post-crisis SVR) that no stationary AR family can represent honestly.
We considered four routes after the AR(1) failure: (a) extend to ARMA(p, q) by BIC; (b) two-state Markov-switching; (c) accept AR(1) with the failure stated; (d) drop the spread layer entirely and bootstrap the Irish rate. Option (a) risks false precision; (c) underplays regime-driven tail risk; (b) is the strongest economic story but identification of transition probabilities is weak. Our decision was to combine (d) and (b): (d) as the headline, (b) as the sensitivity overlay.
6. Limitations of the data
Length of the EUR sample. The ECB DFR series begins January 1999 — 27 years monthly, approximately one and a half full ECB policy-rate cycles. Standard errors on κ are wide; mean-reversion speed is only weakly identified, which is the basis for presenting three Vasicek variants plus a non-parametric bootstrap rather than a single point estimate.
Regime coverage. The 1999–2026 window observes one secular easing cycle (1999–2014), a ZIRP/NIRP plateau (2014–2022), and one tightening cycle (2022–2024). High-rate regimes (1980s-style) are absent by construction; results should be read as a structured stress test under the observed EUR regime, not a forecast across all possible monetary regimes.
Pre-EMU extension. Pre-1999 euro-area policy-rate data does not exist as a single coherent series; synthetic backward-extension would import different monetary regimes and is not used.
AR(1) spread inadequate. The AR(1) spread model fails the Ljung-Box(12) residual-independence test (p = 8.5e-08) and estimates φ = 0.995, very close to a unit root. A two-state Markov-switching model resolves this; a stationary block bootstrap on the Irish rate directly sidesteps the spread model entirely.
Few regime transitions for MS calibration. The two-state Markov-switching spread identifies only one full regime transition (Sep 2010) and one partial reversal (Sep 2022) within the 23-year window; the transition-probability estimates are weakly identified, so the model is presented as sensitivity, not headline.
The substantive caveat: the available European-rate-cycle history contains approximately 1.5 full policy-rate cycles since the foundation of the euro area. No quantitative calibration on this window can claim full-cycle robustness against monetary regimes that have not been observed. We present the simulation as a structured stress test under the observed EUR regime, not a forecast across all possible monetary regimes.
7. Calibration lock
The 50,000-path simulation reported in Annex A was run against the locked MWP-2026-03 base case: representative borrower (age 35, male non-smoker, €322k SA, 30-year term), prevalence stack (D1 = 0.95, D2 = 0.131, D3 = 0.08, D4 = 0.18), real-world projection measure for paths and S(t), EIOPA Q2 2026 risk-free rate for SCR/BEL discounting.
| Item | Locked value |
|---|---|
| Architecture choice | Bootstrap-primary on Irish mortgage rate; Vasicek C1/C2/C3 as ECB-driver sensitivity; two-state Markov-switching spread as Irish-translation sensitivity; AR(1) documented as methodology journey only. |
| Data sources | ECB DFR (FM.D.U2.EUR.4F.KR.DFR.LEV) 1999-01 to 2026-05; Irish mortgage rate (MIR.M.IE.B.A2C.AM.R.A.2250.EUR.N) 2003-01 to 2026-03; both via ECB SDW. |
| Bootstrap parameters | Stationary block bootstrap, mean block = 24 months on monthly differences. n_source = 278. |
| Vasicek parameters | C1, C2, C3 calibrated as reported in §3, parameters locked in diagnostics.json. |
| Markov-switching parameters | Two-state, EM-converged; means, sigmas and transition matrix as reported in §4. |
| Disturbance prevalences | Held constant at base-case values (D1=0.95, D2=0.131, D3=0.08, D4=0.18). |
| Path count and horizon | 50,000 paths, 360 months. |
| Output metrics | Distribution of HARM A, HARM B and SCR_mort, with median, 5/95 and 1/99 percentiles. |
| Discounting | EIOPA Q2 2026 risk-free curve for SCR/BEL discounting; real-world measure for projection. |
Sources: ECB Statistical Data Warehouse (DFR and MIR series); CBI Retail Interest Rates; Politis and Romano (1994) for the stationary bootstrap; Hamilton (1989) and Kim (1994) for the Markov-switching filter; EIOPA Risk-Free Interest Rate Term Structures (30-Apr-2026 EUR no-VA).