Annex A to The Decreasing-Term Anachronism (MWP-2026-03). A 50,000-path stochastic-rate overlay on the base case · five-lens architecture.
Purpose of this annex. The parent paper documents a deterministic mortgage-protection modernisation case at a 4.0% modal interest rate. This annex re-runs the HARM A bill across 50,000 stochastic rate paths under five lenses agreed in the diagnostics pack (Annex B), holding every non-rate base-case assumption fixed. The result is a directional confidence test, not a re-forecast: each lens answers the question "what would the harm bill have looked like if the rate environment had varied in this way?"
Headline result
Under the Bootstrap-Irish headline lens, the median household pays €25.94 per year of harm under the legacy product, with a 5–95% range of €6.07–€44.35. Across the Irish PDH stock (≈698,000 households), the 30-year present value at the EIOPA Q2 2026 risk-free rate is €345.4m (5–95%: €100.3m–€587.4m).
The deterministic base case prints €17.68 per household per year at the 4% modal rate. The Bootstrap-Irish median is materially higher because the bootstrap inherits the actual 2003–2026 regime mix — in particular the 2014–2022 ZIRP plateau — in which low rates implied larger excess sums-assured and therefore larger harm. The four parametric lenses bracket this picture.
| Lens | HARM A per HH/yr, median € | HARM A per HH/yr, 5–95 € | HARM A PDH PV 30y, median €m | HARM A PDH PV 30y, 5–95 €m |
|---|---|---|---|---|
| Bootstrap-Irish (headline) | 25.94 | 6.07–44.35 | 345 | 100–587 |
| Vasicek C1 + MS2 (preferred parametric) | 17.09 | 5.65–30.66 | 224 | 77–400 |
| Vasicek C1 + flat | 23.60 | 11.36–36.41 | 313 | 158–475 |
| Vasicek C2 + flat | 13.76 | 8.35–19.48 | 192 | 119–268 |
| Vasicek C3 + flat | 19.70 | 4.83–37.74 | 265 | 78–488 |
1. Architecture recap
The diagnostics pack (Annex B) agreed a five-lens architecture, restated here for reference.
| Lens | Role | Method (brief) |
|---|---|---|
| Bootstrap-Irish | Headline | Stationary block bootstrap of monthly Irish-mortgage-rate differences (Politis-Romano, block = 24mo, n_source = 278). Integrate diffs from spot 3.50% (Mar 2026); 0% Irish floor. |
| Vasicek C1 + MS2 | Preferred parametric | Vasicek (κ=0.063, θ=0.83%, σ=0.467 pp) on ECB DFR + two-state Markov-switching mortgage spread. |
| Vasicek C1 + flat | Sensitivity | Same Vasicek C1 driver; spread held flat at long-run mean (2.02 pp). |
| Vasicek C2 + flat | Lower bracket | Reinsurance convention: κ = 0.20 [fixed], θ = 2.50% [fixed]. Fast mean-reversion, half-life ≈ 3.5 y. |
| Vasicek C3 + flat | Upper bracket | Near random walk: κ = 0.02 [fixed], θ = data mean. Slow mean-reversion, half-life ≈ 35 y. |
What this annex varies — the Irish-mortgage-rate path across the 30-year horizon, and through the locked workbook M5 sensitivity curve, the implied excess sum-assured and the annual HARM A bill per household.
Held constant — the representative borrower (age 35, male non-smoker, €322k SA, 30-year term), the prevalence stack (D1 = 0.95, D2 = 0.131, D3 = 0.08, D4 = 0.18), the PDH stock multiplier (≈698,000 households), and the SCR_mort structure.
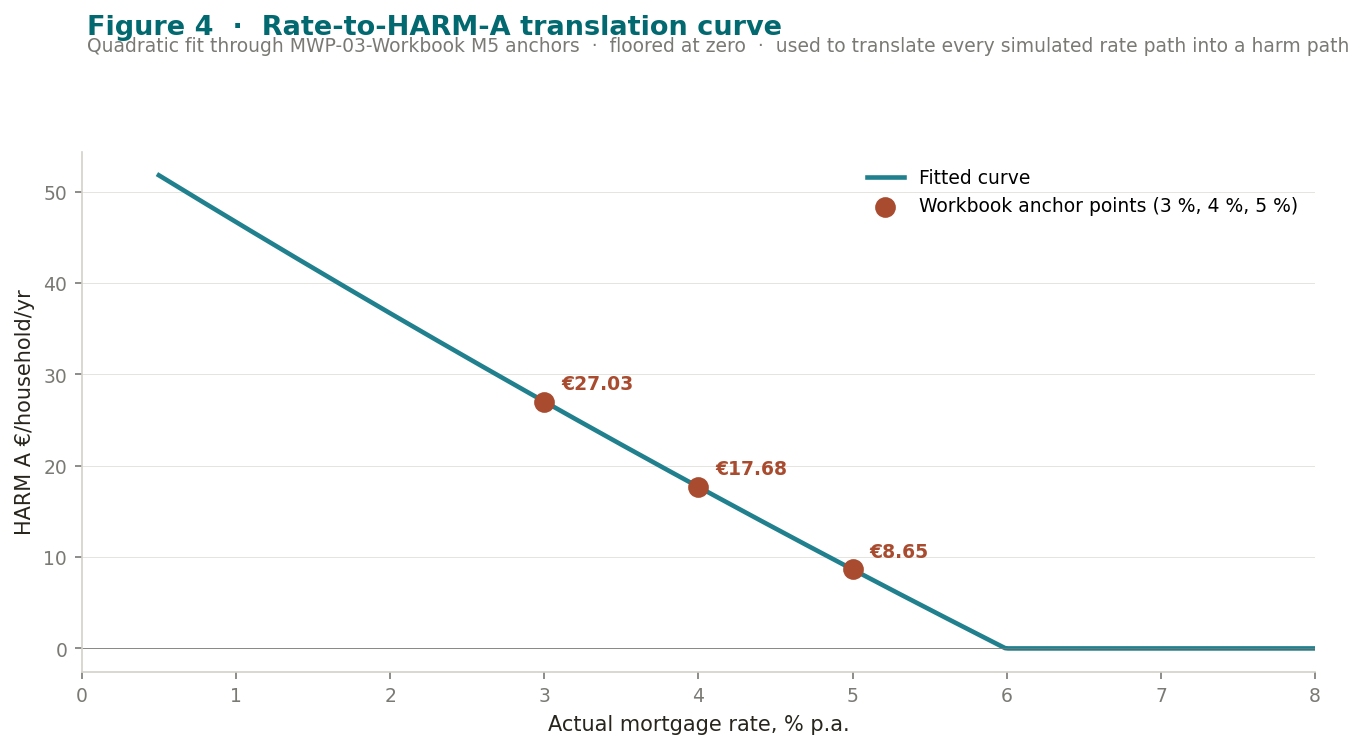
Translation curve. Every simulated rate path is converted into a harm path through the same quadratic fit through the workbook M5 anchor points: (3%, €27.03/yr), (4%, €17.68/yr), (5%, €8.65/yr). Harm is floored at zero (rates above ≈5.99% produce no excess premium under the M5 model).
Floor convention. The ECB DFR driver is not floored; the 2019–2022 episode of ECB DFR at −0.50% is treated as part of the in-sample regime. The Irish mortgage-rate translation is floored at 0%, a level the consumer series has never approached (the empirical minimum during the ZIRP era was 2.70% in April 2021). The 0% floor prevents simulation-only paths from generating economically implausible negative consumer borrowing costs.
2. Simulation configuration
All five lenses share the same seed, horizon, and path count. Vasicek lenses use antithetic variates to halve sample noise without altering the simulation expectation.
| Parameter | Value |
|---|---|
| Path count | 50,000 |
| Horizon | 360 months (30 years) |
| RNG seed | 20260529 |
| Antithetic variates | Yes (Vasicek lenses) |
| Starting Irish rate r0 | 3.50% (CBI MIR, latest) |
| Starting ECB DFR r0 | 2.00% (ECB SDW, latest) |
| Irish-rate floor | 0% (asymmetric; no driver floor) |
| Translation curve | Quadratic fit through workbook M5 anchors, floored at zero |
| Discounting | EIOPA EUR RFR (no-VA), 30-Apr-2026; 30y spot = 3.188% |
| PDH stock multiplier | 697,964 households (€12.34m / €17.68) |
3. Rate path distributions
The Bootstrap-Irish lens drifts gently toward the 2003–2026 historical mean (3.49%), with a wide 5–95% cone. Vasicek C1+MS2 starts from a higher Irish-rate spot and reverts to its long-run mean of ≈3.8%. The reinsurance C2 lens reverts quickly to its fixed long-run mean, and the near-RW C3 lens diffuses widely with weak central tendency.
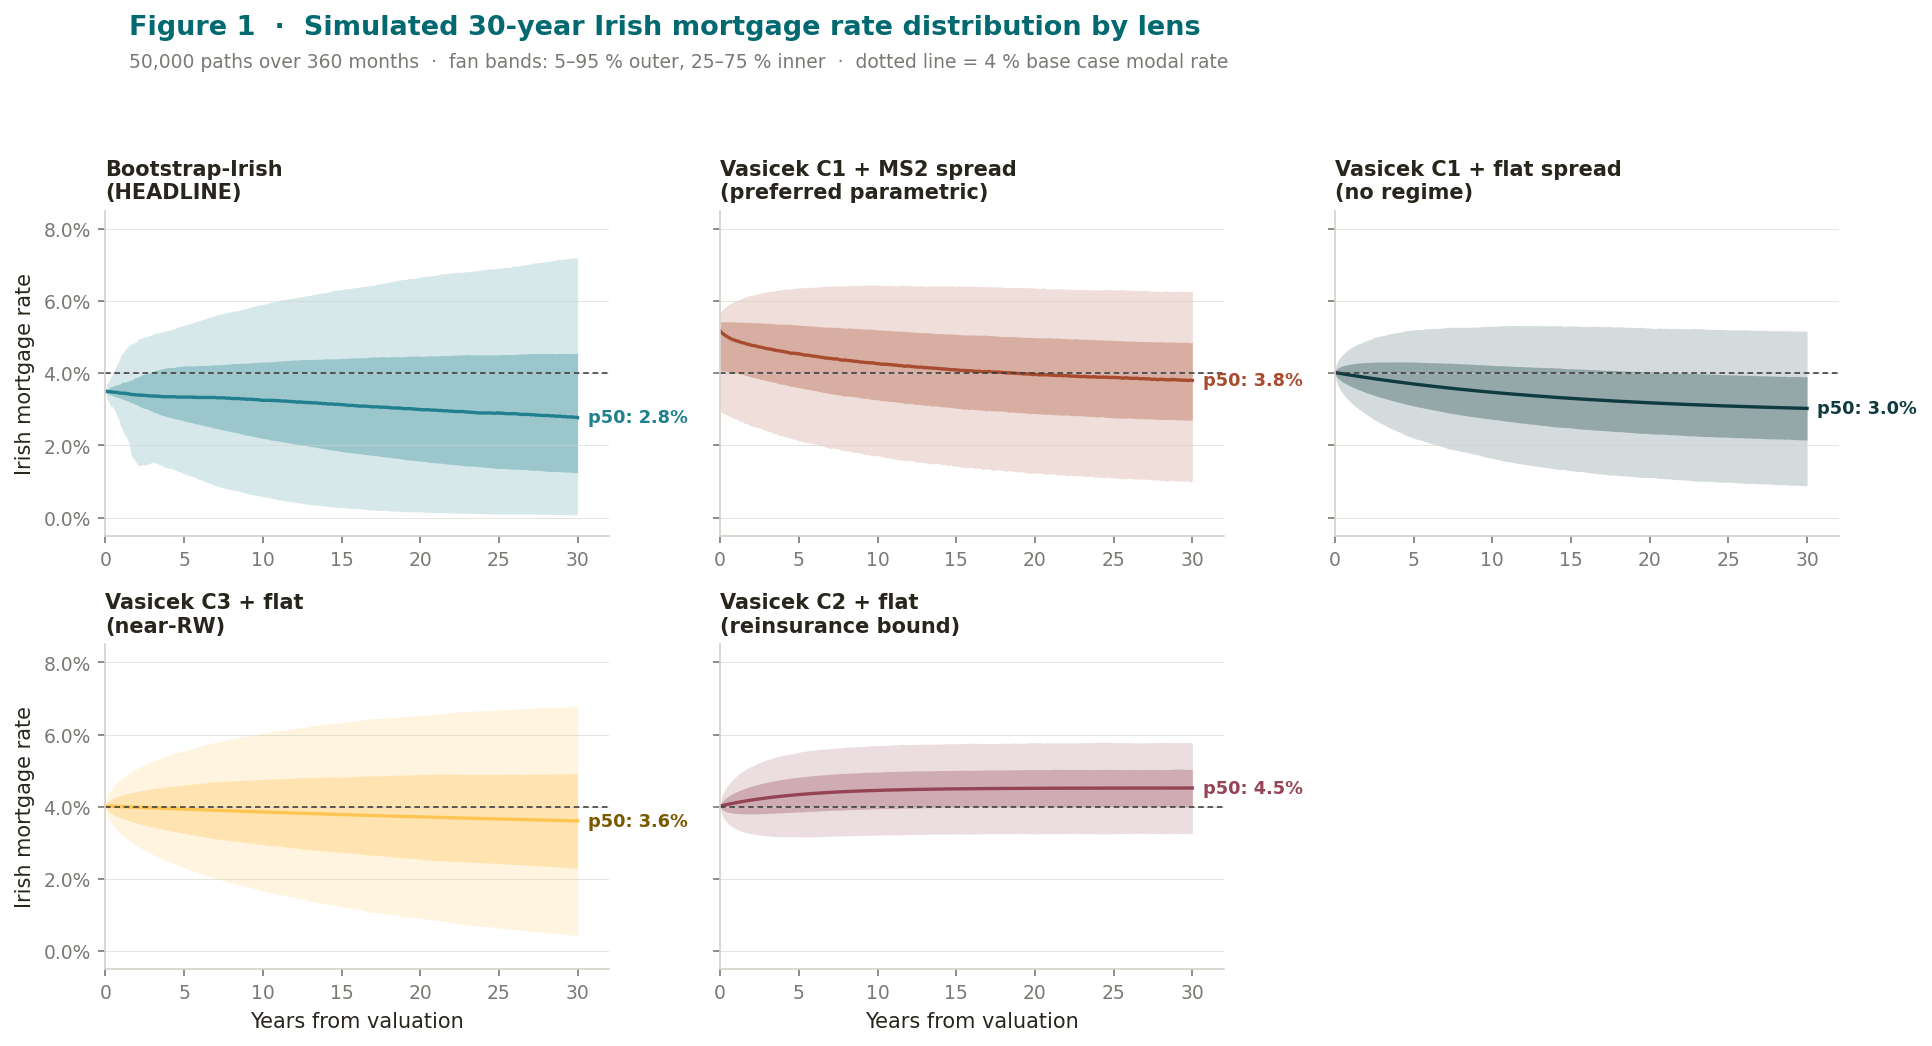
| Lens | Final rate p05 | p50 | p95 | Mean 30y p50 |
|---|---|---|---|---|
| Bootstrap-Irish (headline) | 0.08% | 2.77% | 7.21% | 3.13% |
| Vasicek C1 + MS2 | 1.02% | 3.80% | 6.27% | 4.10% |
| Vasicek C1 + flat | 0.88% | 3.03% | 5.17% | 3.37% |
| Vasicek C2 + flat | 3.27% | 4.52% | 5.77% | 4.44% |
| Vasicek C3 + flat | 0.42% | 3.61% | 6.80% | 3.79% |
The four parametric lenses agree to within 150 bps on the median final rate (3.0–4.5%) but disagree sharply on the 5–95 spread — a direct reflection of the calibration uncertainty in κ. The Bootstrap-Irish median (2.77%) sits below all parametric medians because the bootstrap inherits the 2014–2022 ZIRP plateau in its source diffs.
4. HARM A per-household distribution
Translating each simulated rate path through the workbook M5 curve produces a HARM A path per household. Distributions are right-skewed in the parametric lenses (more upside in low-rate paths, since harm rises as rate falls) and approximately symmetric in the bootstrap lens.
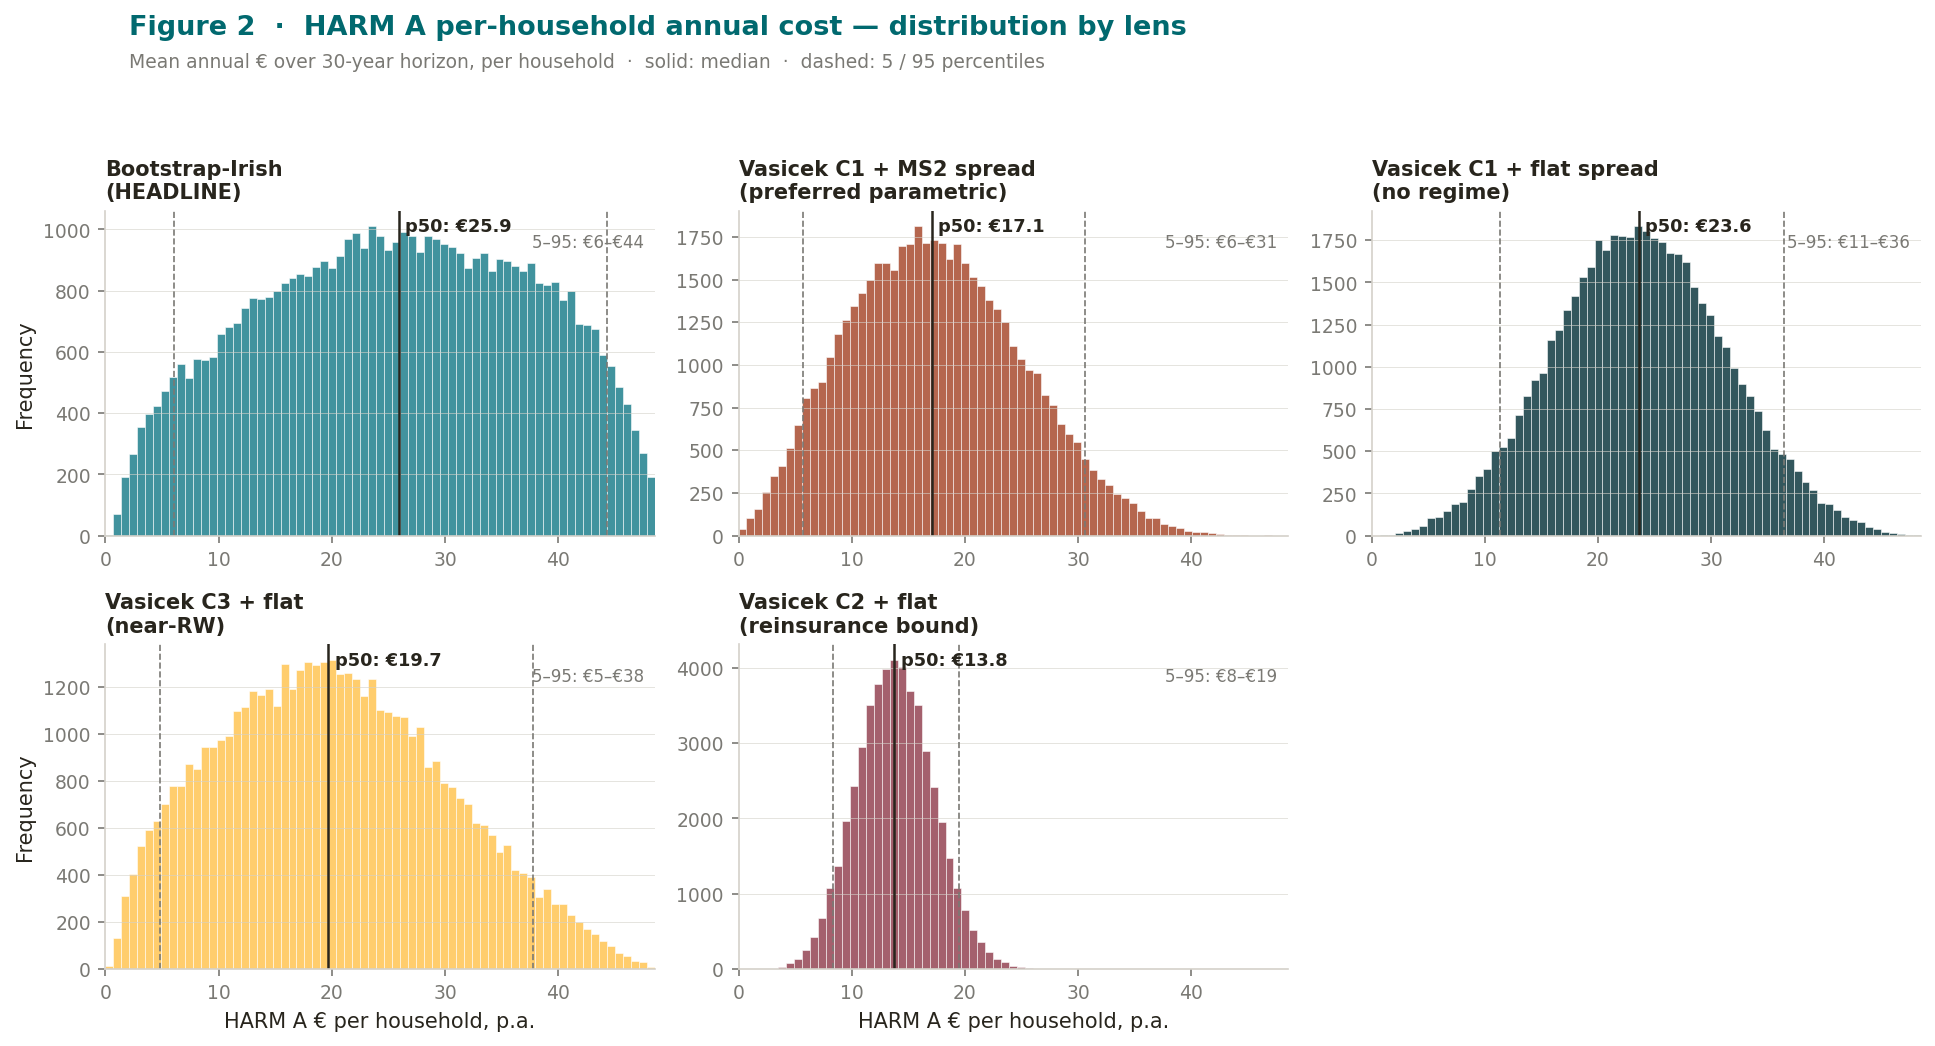
| Lens | p05 | p25 | p50 | p75 | p95 | Mean |
|---|---|---|---|---|---|---|
| Bootstrap-Irish | €6.07 | €16.40 | €25.94 | €35.36 | €44.35 | €25.73 |
| Vasicek C1 + MS2 | €5.65 | €11.83 | €17.09 | €22.67 | €30.66 | €17.47 |
| Vasicek C1 + flat | €11.36 | €18.49 | €23.60 | €28.81 | €36.41 | €23.70 |
| Vasicek C2 + flat | €8.35 | €11.49 | €13.76 | €16.08 | €19.48 | €13.82 |
| Vasicek C3 + flat | €4.83 | €12.57 | €19.70 | €27.21 | €37.74 | €20.22 |
The deterministic base case prints €17.68 per household per year. The Bootstrap-Irish median (€25.94) is about 47% higher because the bootstrap inherits the low-rate years 2014–2022 directly into its source diffs. The C1+MS2 parametric median (€17.09) sits just below the base case because its long-run mean is anchored higher (≈3.8%, where harm is lower).
5. HARM A across the Irish PDH stock
Scaling the per-household path-PV by the implied PDH-stock multiplier (≈697,964 households) and discounting at the EIOPA EUR risk-free rate at 30-Apr-2026 gives the aggregate 30-year present value of HARM A under each lens.
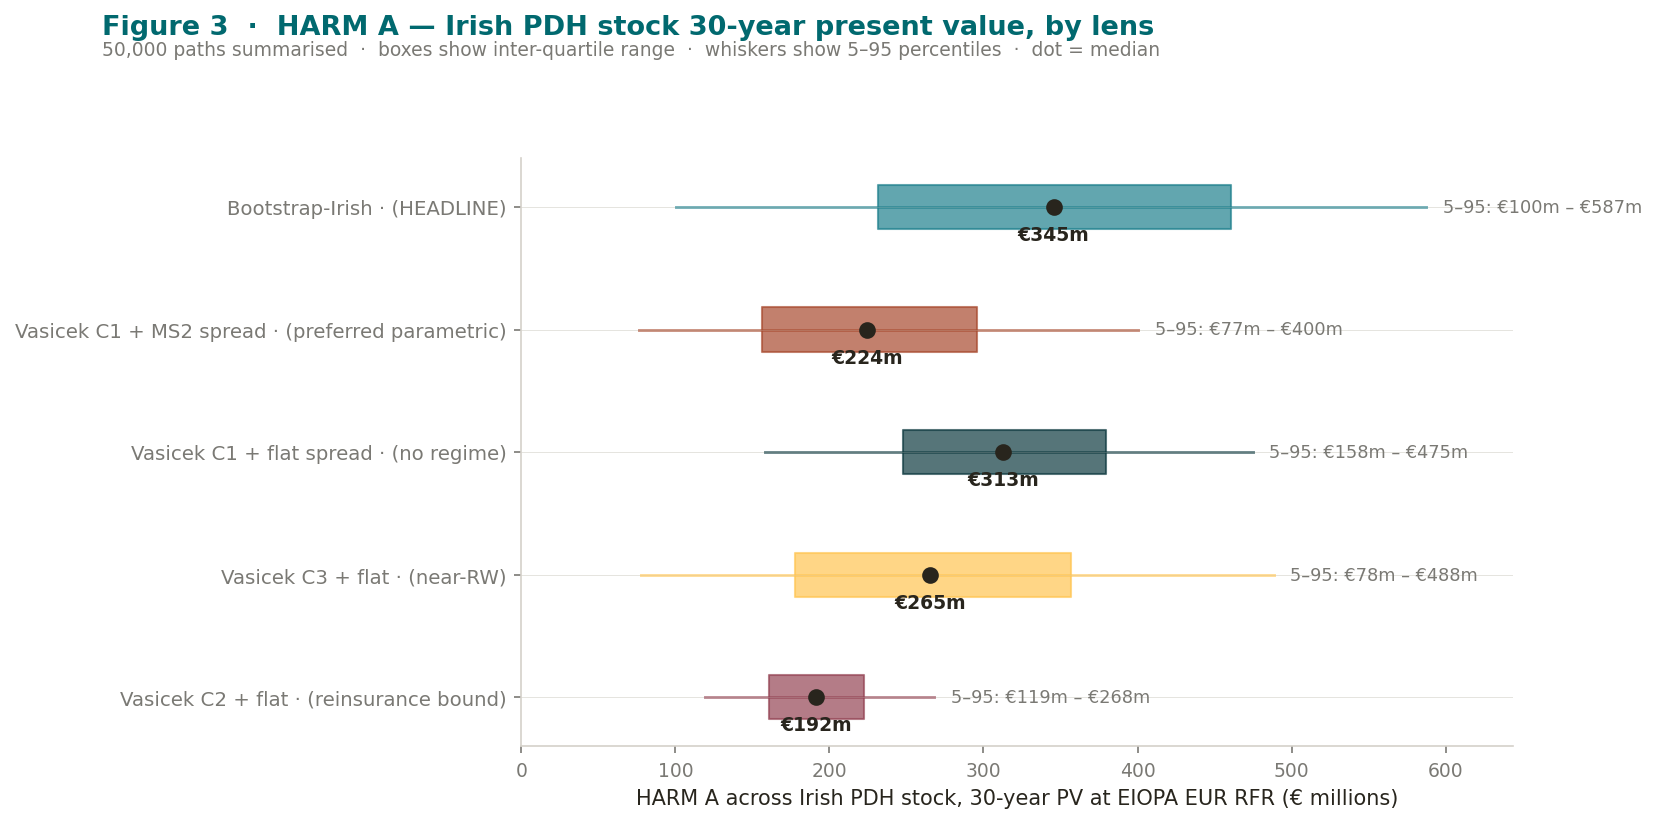
| Lens | p05 €m | p25 €m | p50 €m | p75 €m | p95 €m | Mean €m |
|---|---|---|---|---|---|---|
| Bootstrap-Irish | 100 | 232 | 345 | 461 | 587 | 346 |
| Vasicek C1 + MS2 | 77 | 156 | 224 | 296 | 400 | 229 |
| Vasicek C1 + flat | 158 | 248 | 313 | 379 | 475 | 314 |
| Vasicek C2 + flat | 119 | 161 | 192 | 223 | 268 | 192 |
| Vasicek C3 + flat | 78 | 178 | 265 | 357 | 488 | 271 |
The Bootstrap-Irish median PV (€345m) is approximately 1.54× the C1+MS2 median (€224m) and 1.80× the reinsurance-bound C2 median (€192m). The full 5–95 envelope across all lenses runs €77m to €587m. Every lens places the median 30-year PV between €190m and €350m: the simulation does not move the qualitative conclusion of the parent paper, it quantifies a bracket on the size of the overhang under rate-environment uncertainty.
6. Interpretation and limitations
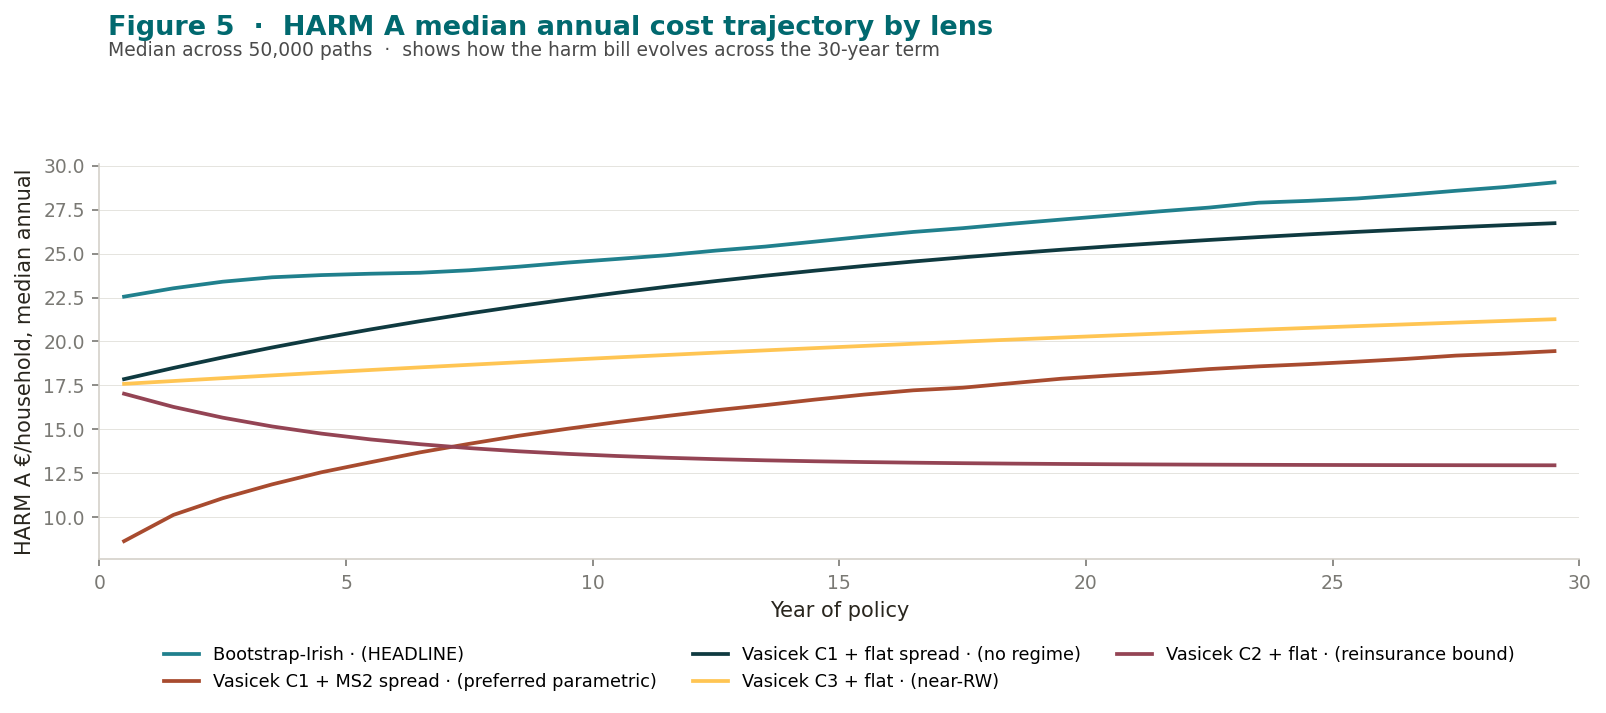
Why the Bootstrap-Irish lens sits high. It draws its monthly differences from the 2003–2026 Irish-mortgage-rate history. Approximately one-third of that window (Sep 2014–Aug 2022) lies in the ZIRP plateau, where Irish mortgage rates sat in the 2.7–3.5% band. Because HARM A is monotonically decreasing in rate over the relevant range, paths spending time in that band produce higher harm. This is not a forecast that rates will return to ZIRP — it is a statement that, in the only Irish-rate cycle we have, ZIRP-like conditions were a non-trivial fraction of the regime mix.
Why the parametric lenses sit lower. Each anchors its long-run mean above 3%, and the convex translation curve means a distribution that revisits the ZIRP band less often produces a lower median harm. The reinsurance-convention C2 lens sits lowest because its κ = 0.20 pulls paths quickly back to its fixed long-run mean.
Robustness of the directional conclusion. Despite the spread across lenses, every lens produces a median annual HARM A per household between €13.8 and €25.9 — the entire range sits well above zero. No simulated lens, and no 5–95 lower tail, places median harm below €5/HH/yr. The modernisation thesis is robust to the rate-environment uncertainty modelled here.
What the simulation does not address. Prevalence uncertainty (D1–D4) is held at the locked base-case stack; the PDH-stock multiplier is held at ≈698k; lapse behaviour and reinsurance treaty terms are held at base case; and the modernised-design SCR consequence (the +27% headline) is taken from the parent paper as a structural calibration, not re-simulated. All limitations documented in the diagnostics pack (Annex B §6) remain: approximately 1.5 ECB policy-rate cycles in the available EUR sample; the bootstrap cannot extrapolate beyond the observed regime mix; the parametric κ is weakly identified.
7. Run provenance
| Item | Locked value |
|---|---|
| Simulator | /mwp3/stochastic/simulate.py (vectorised numpy, deterministic seed) |
| Chart builder | /mwp3/stochastic/build_sim_charts.py |
| PDF builder | /mwp3/stochastic/build_sim_annex.py |
| Results JSON | /mwp3/stochastic/sim_outputs/results.json |
| Path arrays (5 lenses) | sim_outputs/paths_{bootstrap,c1_flat,c1_ms2,c2_flat,c3_flat}.npz |
| Harm arrays (5 lenses) | sim_outputs/harm_{bootstrap,c1_flat,c1_ms2,c2_flat,c3_flat}.npz |
| RNG seed | 20260529 |
| Path count | 50,000 |
| Horizon | 360 months |
| Discount curve | EIOPA EUR risk-free, no-VA, 30-Apr-2026 |
Block-bootstrap method: Politis, D. N. and Romano, J. P. (1994), "The Stationary Bootstrap", Journal of the American Statistical Association, 89(428), pp. 1303–1313. Discount basis: EIOPA Risk-Free Interest Rate Term Structures, 30-Apr-2026 EUR no-VA curve, 30-year spot 3.188%. Rate data: ECB Statistical Data Warehouse (MIR and DFR series) and CBI Retail Interest Rates. Translation anchors: MWP-03-Workbook.xlsx, sheet M5.